iOS App Development
iOS WebView Debugging
April 28, 2023
Debugging the safari and webview content we use in the application on the device via the computer.
In projects where webview is used, we can resolve errors on the web page by debugging pages and JavaScripts. To do this, you need to connect the device to your computer and use your browser’s developer settings.
Debugging iOS Web Views
In iOS webview, console.log() messages from the web page cannot be displayed in Xcode logs. For this reason, we can easily track logs and perform debugging by using Safari’s developer settings.
- Safari is required to debug iOS web views, so your developer computer must be running macOS.
- You can only debug web views in applications installed on your device via Xcode. You cannot debug web views in applications installed via the App Store or Apple Configurator.
Considering these limitations, here are the steps for remote debugging of a web view in iOS:
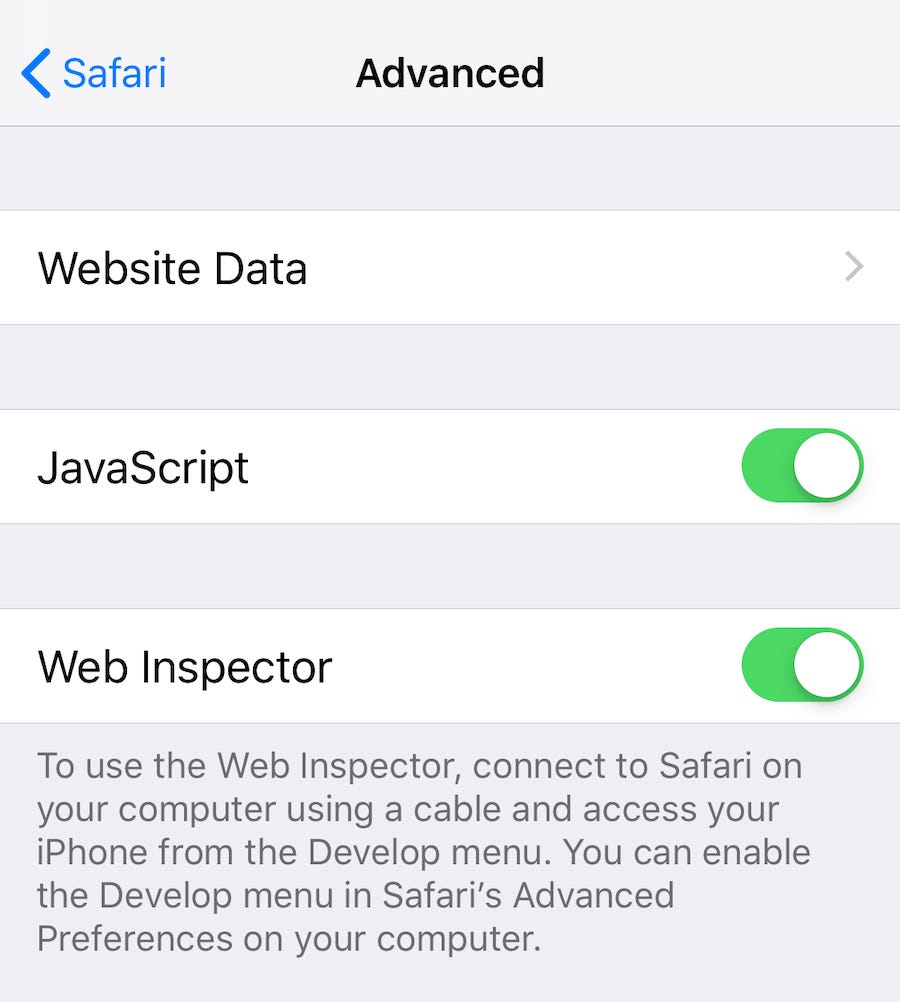
- First, enable Safari Web Inspector on your iOS device by opening the iOS Settings app, navigating to Settings > Safari > Advanced, and switching the Web Inspector option to on.
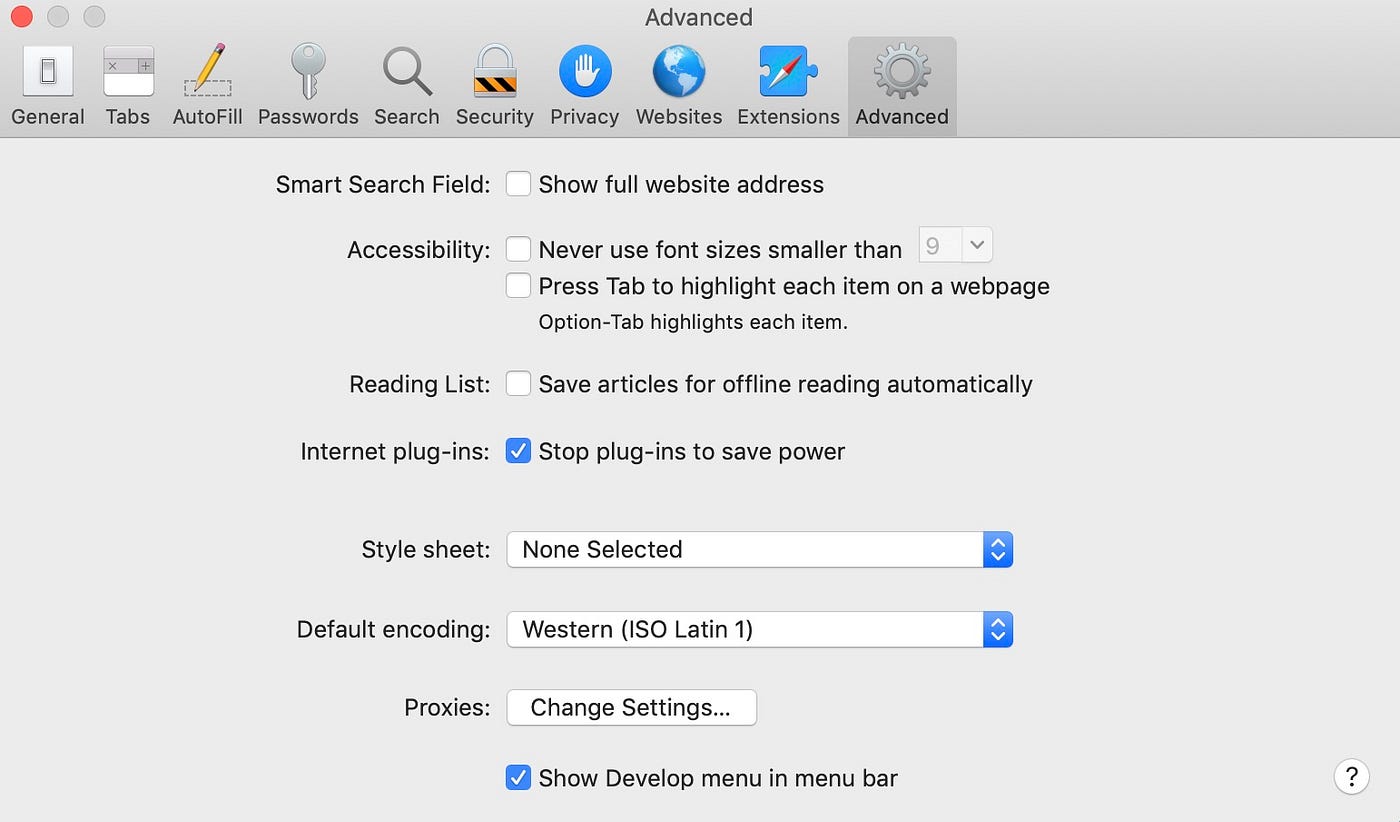
2. Next, you must also enable developer tools in Safari on your development computer. Launch Safari on your development computer and go to Safari > Preferences in the menu bar. In the preferences pane that appears, click on the Advanced tab, and then enable the Show Develop menu option at the bottom. After doing this, you can close the preferences pane.
3. Connect your iOS device to your development computer and launch your application or safari.
4. In Safari on your development computer, click Develop in the menu bar and select your iOS device name to display a list of webview instances running on your iOS device.
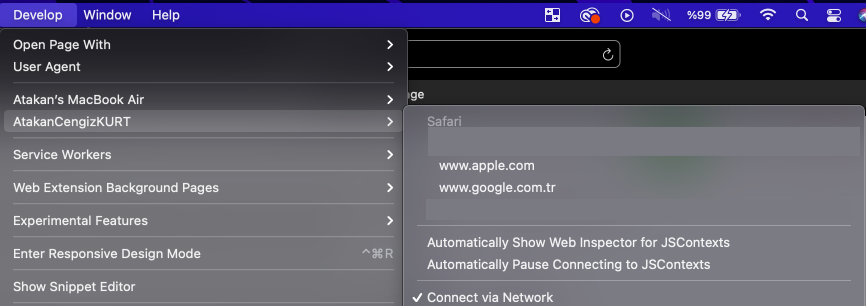
5. Click the dropdown option for the web view you want to debug. This will open a new Safari Web Inspector window to inspect the web view.

Author: Atakan Cengiz Kurt